Note
Go to the end to download the full example code.
Chocolate cake of chaos
In the book, we look at two stories, Alex story about attendance at a bar and Richard’s problems with chocolate cake over consumption. These are both captured by the same mathematical model.
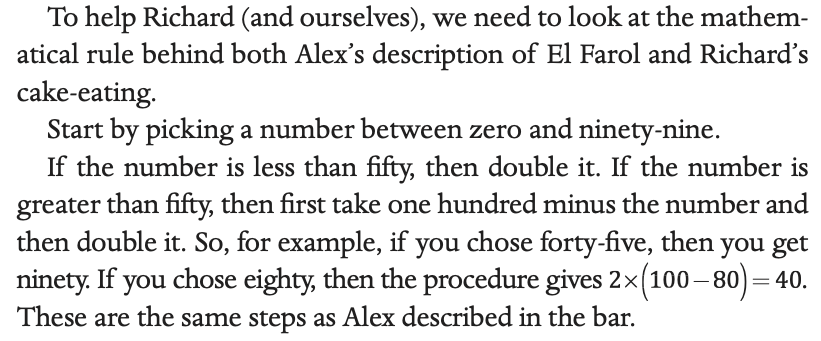
In Alex story we take the attendance at the bar the previous week, :math:´x_t’ double it. If :math:´2x_t leq 50’ then the number of visitors the next week is
On the other hand, if :math:´2x_t > 50’ then the number of visitors next week is
Let’s implement this in Python
import numpy as np
import matplotlib.pyplot as plt
from pylab import rcParams
import matplotlib
rcParams['figure.figsize'] = 12/2.54, 6/2.54
matplotlib.font_manager.FontProperties(family='Helvetica',size=11)


def tentmap(x0,n):
    xs=np.zeros(n+1)
    xs[0]=x0
    for k in range(n):
        xs[k+1]= 2* min(xs[k],100-xs[k])
    return(xs)

x0=20
print('One iteration:' )
print(tentmap(x0,1))
print('Two iterations:' )
print(tentmap(x0,2))
print('Three iterations:' )
print(tentmap(x0,3))
One iteration:
[20. 40.]
Two iterations:
[20. 40. 80.]
Three iterations:
[20. 40. 80. 40.]
If we keep iterating, we get
print('Eleven iterations:' )
print(tentmap(x0,11))
Eleven iterations:
[20. 40. 80. 40. 80. 40. 80. 40. 80. 40. 80. 40.]
Chocolate cake
In Richard chocolate cake story we look at the difference between starting with 13 and 14. This can be simulated as follows.
print('Starting with 13:' )
print(tentmap(13,7))
print('Starting with 14:' )
print(tentmap(14,7))
Starting with 13:
[13. 26. 52. 96.  8. 16. 32. 64.]
Starting with 14:
[14. 28. 56. 88. 24. 48. 96.  8.]
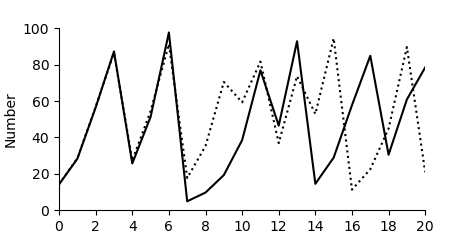
Let’s make the difference only 0.1, as we do in the figure in the book and see what happens.
def formatFigure(ax,n):
    ax.set_ylabel('Number')
    ax.set_xlabel('Step')
    ax.set_ylim((0,100))
    ax.set_xlim((0,n))
    ax.set_xticks(range(0,n+1,2))
    ax.set_yticks(range(0,101,20))
    ax.spines['top'].set_visible(False)
    ax.spines['right'].set_visible(False)

n=20

fig,ax=plt.subplots(num=1)
ax.plot(tentmap(14.1,n), color='black')
ax.plot(tentmap(14.2,n), color='black',linestyle=':')
formatFigure(ax,n)
plt.show()
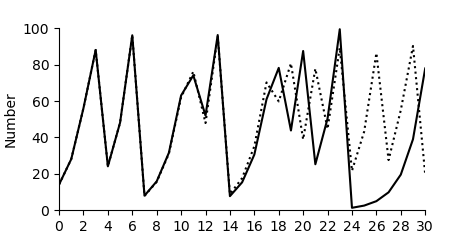
And now let’s make the difference only 0.001
n=30

fig,ax=plt.subplots(num=1)
ax.plot(tentmap(14.001,n), color='black')
ax.plot(tentmap(14.002,n), color='black',linestyle=':')
formatFigure(ax,n)
plt.show()
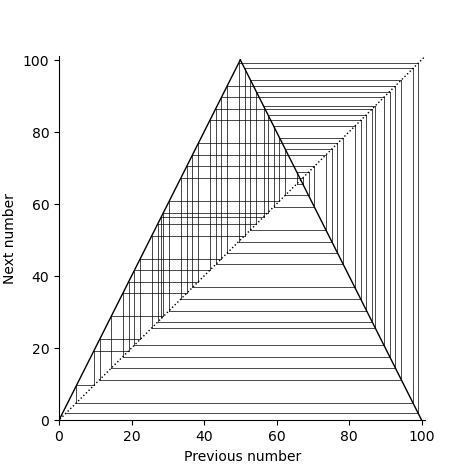
Cobweb diagrams
HAVE MATERIAL HERE.
n = 50

xs = tentmap(14.1,50)
xp = xs[1]

rcParams['figure.figsize'] = 12/2.54, 12/2.54
fig,ax=plt.subplots(num=1)

for x in xs[2:]:

    ax.plot([xp, xp],[xp, x],color='k',linewidth=0.5)
    ax.plot([xp, x],[x, x],color='k',linewidth=0.5)
    xp = x


ax.plot([-0.5, 105.5],[-0.5, 105.5],linestyle=':',color='k',linewidth=1)
ax.plot([100, 50],[0, 100],color='k',linewidth=1)
ax.plot([0, 100/2],[0, 100],color='k',linewidth=1)
ax.set_xlabel('Previous number')
ax.set_ylabel('Next number')
ax.spines['top'].set_visible(False)
ax.spines['right'].set_visible(False)
ax.set_xticks(np.arange(0,101,step=20))
ax.set_yticks(np.arange(0,101,step=20))
ax.set_xlim(0,101)
ax.set_ylim(0,101)
plt.show()
Total running time of the script: (0 minutes 0.208 seconds)