Note
Go to the end to download the full example code.
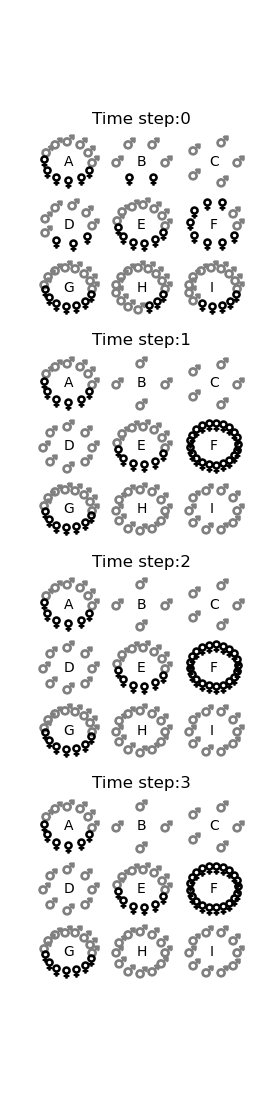
Hard edges of social reality
In the book, I describe a story about how people choose which group to stand in at a party. Here is an illustration of the moves people make

This section provides the code for the model described in the book.
import pandas as pd
import matplotlib.pyplot as plt
import matplotlib
import numpy as np
from pylab import rcParams
rcParams['figure.figsize'] = 7/2.54, 28/2.54
matplotlib.font_manager.FontProperties(family='Helvetica',size=11)

# This function helps us plot on a circle
def PointsInCircum(r,n=100):
    xv=np.zeros(int(n))
    yv=np.zeros(int(n))
    for x in np.arange(n):
        xv[int(x)]=np.cos(2*np.pi/n*x)*r
        yv[int(x)]=np.sin(2*np.pi/n*x)*r

    return xv,yv

# This function plots the groups
def plotGroups(ax,group_male,group_female,title):


    counti=0
    for j in [15,0,-15]:
        for i in [-15,0,15]:

            x,y = PointsInCircum(5.0,n=group_male[counti]+group_female[counti])

            ax.plot(i+ x[0:int(group_male[counti])], j+ y[0:int(group_male[counti])], linestyle='none', markersize=8, color='grey', marker='$\u2642$')
            ax.plot(i +x[int(group_male[counti]):],j+y[int(group_male[counti]):], linestyle='none', markersize=8, color='black', marker='$\u2640$')

            ax.text(i-1,j-1,chr(64+counti+1))

            ax.spines['bottom'].set_visible(False)
            ax.spines['left'].set_visible(False)
            ax.spines['top'].set_visible(False)
            ax.spines['right'].set_visible(False)
            counti=counti+1

            ax.set_xticks([-30,30])
            ax.set_yticks([-30,30])
            ax.set_xlim(-22,22)
            ax.set_ylim(-22,22)

    ax.set_title(title)
Set up the simulation
males=60
females=40
groups=9

ok_male=0.34
ok_female=0.34

group_male=np.zeros(groups)
group_female=np.zeros(groups)


for m in range(males):
    g = int(np.floor(np.random.rand(1)*groups))
    group_male[g]=group_male[g]+1

for f in range(females):
    g = int(np.floor(np.random.rand(1)*groups))
    group_female[g]=group_female[g]+1

group_male_new=group_male
group_female_new=group_female
/home/docs/checkouts/readthedocs.org/user_builds/fourways/checkouts/latest/course/lessons/lesson4/plot_hardedges.py:81: DeprecationWarning: Conversion of an array with ndim > 0 to a scalar is deprecated, and will error in future. Ensure you extract a single element from your array before performing this operation. (Deprecated NumPy 1.25.)
  g = int(np.floor(np.random.rand(1)*groups))
/home/docs/checkouts/readthedocs.org/user_builds/fourways/checkouts/latest/course/lessons/lesson4/plot_hardedges.py:85: DeprecationWarning: Conversion of an array with ndim > 0 to a scalar is deprecated, and will error in future. Ensure you extract a single element from your array before performing this operation. (Deprecated NumPy 1.25.)
  g = int(np.floor(np.random.rand(1)*groups))
Move through step by step
fig,axs=plt.subplots(4,1)

for t in range(4):

    plotGroups(axs[t],group_male,group_female,'Time step:%d'%t)

    for g in range(groups):

        if group_male[g]/(group_female[g]+group_male[g]) < ok_male:
            #Men leaves
            while group_male_new[g]>0:
                group_male_new[g]=group_male_new[g]-1
                #Group with more males than females
                new_g=np.random.choice(np.where(group_male > group_female)[0])
                group_male_new[new_g]=group_male_new[new_g]+1


                change=True
            #Woman leaves
        if group_female[g]/(group_female[g]+group_male[g]) < ok_female:

            while group_female_new[g]>0:
                group_female_new[g]=group_female_new[g]-1
                #Group with more females than males
                new_g=np.random.choice(np.where(group_male < group_female)[0])
                group_female_new[new_g]=group_female_new[new_g]+1

                change=True

    #Update groups.
    group_male=group_male_new
    group_female=group_female_new


plt.show()
Total running time of the script: (0 minutes 0.514 seconds)